Flood Vulnerability Assessment

Project Status
Study: In progress
Public Information Meeting: Vulnerability Assessment
Pinellas County hosted a Flood Vulnerability Assessment Virtual Public Information meeting on Jan. 13, 2026 from 6:00 p.m. – 7:30 p.m. This meeting presented findings from the Vulnerability Assessment and flood modeling that is used to reduce risks for critical infrastructure in the County such as roads and emergency facilities.
Pinellas County is required by the State of Florida to conduct this assessment as a condition for receiving flood risk reduction grant funding.
Overview
Pinellas County is ready to face the unprecedented challenge in the coming decades of adapting to new flood patterns. Flooding from tides and storms is increasing, and areas away from the coast are being affected when rising seas combine with groundwater. The effects on groundwater are especially noticeable when there’s heavy rain and the water doesn’t drain away as expected.
The county has a lot of people living close together, and its geography makes it especially vulnerable to flooding; it has 590 miles of highly developed coastline but is only 15 miles across at its widest point. Sea level rise, storm surge and tidal flooding are expected to increase over time, which puts communities and buildings at even greater risk.
The County already has a successful record addressing these challenges but is going further to better understand these risks and prepare for the future. That’s why Pinellas County is conducting a Flood Vulnerability Assessment.
Want to learn more about different types of flooding that could affect Pinellas County? Use this NOAA interactive tool to understand flood concepts.
What is a Flood Vulnerability Assessment?
In our ongoing vulnerability assessment, we’re evaluating the County’s infrastructure, such as roads and wastewater treatment facilities, to identify areas prone to serious flooding. We’re mapping locations at risk of being underwater during high tides, heavy rain, and storm surge that occurs now and will likely occur in the future. This will help us understand potential operational and economic impacts from sea level rise on county roads and facilities. Preparing for the future will ensure our communities are resilient against the challenges of sea level rise and storm surge.
The assessment will find out the probability of flooding in our community, followed by the consequences of flooding. The County is also gathering input from the community about which public facilities and community values may need to be prioritized as we decide how to address the consequences of flooding. The final product, an adaptation plan, will include the following:
- A comprehensive assessment of the effects of changes in weather patterns on flooding.
- Better and more effective policy proposals.
- An estimate of maintenance/repair and capital investment needs.
- Timeframe for required action and program decisions.
- Methods for prioritizing important projects.
- Information resources for effective communication with anyone affected by flooding.
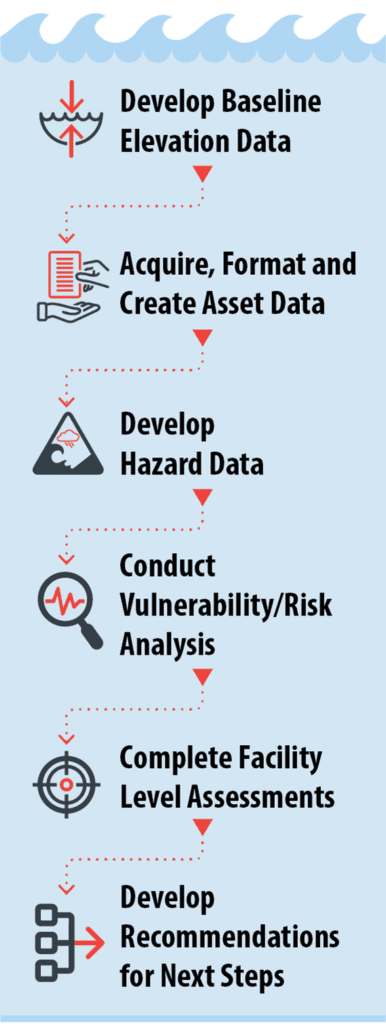
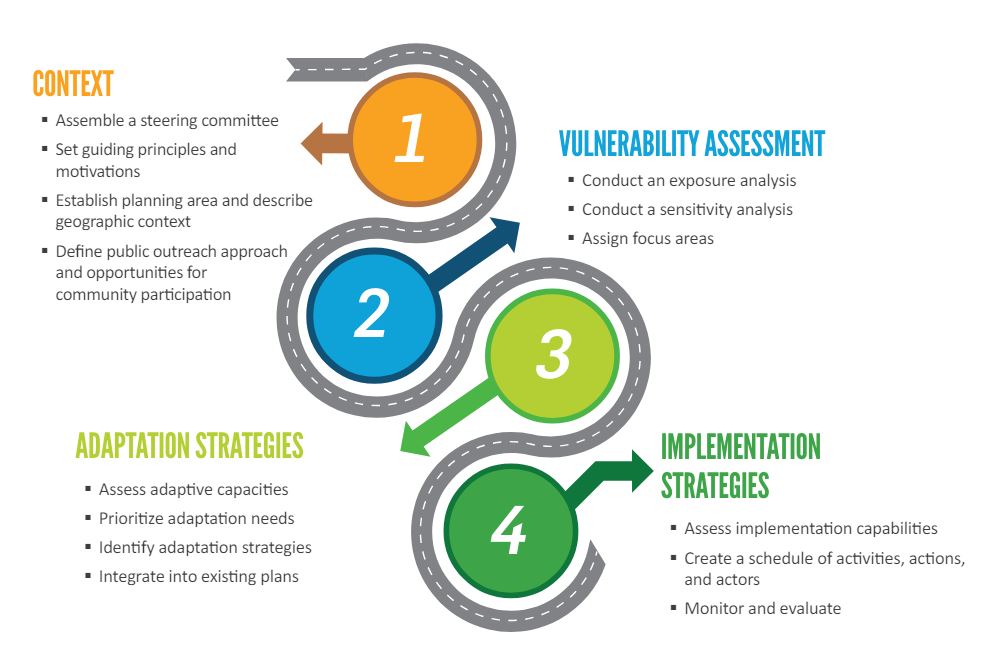
See Figures 1 and 2 for a further breakdown of the assessment process.
What counts as an “asset”?
County-owned properties and County-maintained roads and facilities are considered assets. We’re also asking about the assets in your communities: community centers, libraries, places of worship, or other areas important to you and your neighbors.
How is risk determined?
Risk is just the chance that a specific bad thing happens. First, we figure out vulnerability (example: a fire station along a beach in Florida is vulnerable to a hurricane. A fire station on a mountain in Colorado is probably not vulnerable to a hurricane). Once we understand the vulnerabilities of each asset, we can determine the probability of it happening as well as the consequences if it does.
What is adaptation and adaptive capacity?
We can make changes to adapt to future weather, storms and flooding. Many residents do this every day: installing impact windows to protect against hurricane-force winds, building houses higher up off the ground to protect against flooding, or adding insulation to protect against hotter summers. Sometimes, the best adaptation is to move an asset out of the risk area (like how you might drive your car to higher ground if your neighborhood is probably going to flood soon). Each asset has a different capacity, or ability, to adapt (It’s easy to move a car, but it’s hard to move a school).
Example:
Two businesses, Business A and Business B, are on the same road. Business A has a park next to it, and Business B sits right in the middle of a busy street. During a heavy rainstorm, Business A does not experience as severe of flooding as Business B because the park provides a place for water run-off. Business B is surrounded by concrete surfaces where water does not soak into the ground. Business A & B have the same exposure, but different vulnerability and risk.
Flooding from rainfall
Flooding is often caused by heavy rain, thunderstorms, tropical systems and cold fronts. Changes in rainfall patterns can cause downpours of rain in short periods of time, which may create severe flooding in heavily developed areas with surfaces such as concrete that don’t allow water to soak into the ground. The changes disrupt stormwater systems and the assets like roads that rely on them.
What is storm surge?
Storm surge is the water that is pushed onto land as a hurricane or tropical storm makes landfall. Strong winds over the ocean drive water onshore, which can damage buildings, coastal habitats and beaches, and weaken the foundation of infrastructure like roads and utilities. Rising sea levels combined with the potential for stronger and more frequent storms in the future may cause flooding in areas that previously would not have experienced it.
Tidal flooding and sea level rise
Height of daily tides varies seasonally and from year to year, depending on the position of the earth, sun and moon, and ocean and wind currents. Seasonal high tides can cause “sunny day flooding.” As sea levels rise, so do tides, making flooding in low-lying coastal areas worse. It’s projected that seas will rise one to three feet within the next few decades, which will continue to make tidal flooding worse and more frequent.
Project Phases
Phase 1
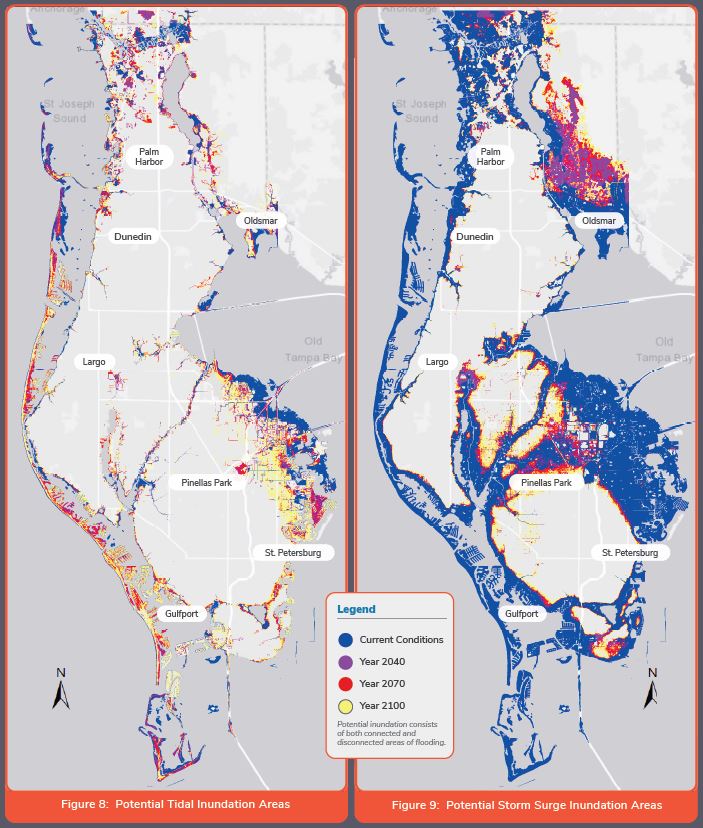
An initial phase of the assessment — completed in 2021 — analyzed the county’s vulnerability to flooding from various sources for the years 2040, 2070 and 2100. Some of the findings from the initial phase include:
- As sea level rises, Pinellas County can expect to see flooding in more areas around our county. This could lead to more severe impacts from storm surge on our homes and businesses.
- Pinellas County can expect more frequent and higher tidal flooding, or “sunny day flooding” during high tide, in low-lying parts of the county.
- Critical infrastructure, such as roadways, pumps, and facilities, will be more vulnerable and at risk of flooding in the future.
Phase 2
In October 2022, Pinellas County was awarded additional funding from the Resilient Florida grant program to launch a second phase of the Flood Vulnerability Assessment. This current phase will expand the project to analyze more County assets, enhance modeling by including more factors (e.g. rainfall) and develop an Adaptation Plan.
The Resilient Florida Program also asked Pinellas County to assist 10 other municipalities: Belleair, Belleair Beach, Belleair Shores, Indian Rocks Beach, Indian Shores, Madeira Beach, North Redington Beach, Pinellas Park, Redington Beach, and Redington Shores. These municipalities will follow the same timeline for their Vulnerability Assessment Report (Spring 2026) and Adaptation Plan (Fall 2026).
Pinellas County’s Flood Vulnerability Assessment is part of a statewide effort to make our communities more resilient. Learn more.
Community Engagement
Jan. 13, 2026: Pinellas County hosted a Flood Vulnerability Assessment Virtual Public Information meeting. This meeting presented findings from the Vulnerability Assessment and flood modeling that is used to reduce risks for critical infrastructure in the County such as roads and emergency facilities. Pinellas County is required by the State of Florida to conduct this assessment as a condition for receiving flood risk reduction grant funding.
This work was funded in part through a grant agreement from the Florida Department of Environmental Protection’s Office of Resilience and Coastal Protection Resilient Florida Program. The views, statements, findings, conclusions, and recommendations expressed herein are those of the author(s) and do not necessarily reflect the views of the State of Florida or any of its subagencies.